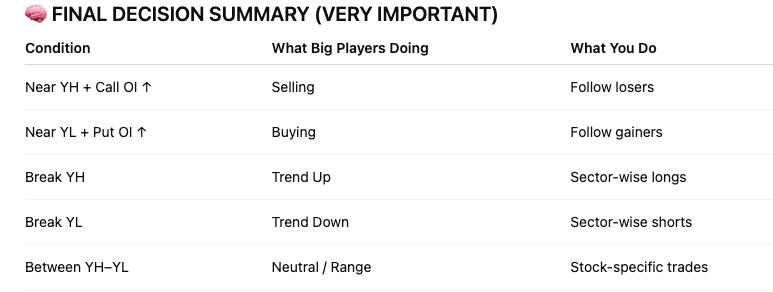
Step-3: NIFTY50 YH-YL Position analysis - 1.Cross YH-YL 2.Between YH-YL 3.Gapup/down open YH-YL.
Step-4: NSE Index Heatmap/ Intraday Screener - Verify top bullish or bearish. - Even index not performed - stocks has 2-3% momentum.
Step-5: ADR Data verify with this match or not.
Step-6: Filter stocks and verify 5min chart research. 1. 1st 5min high and low cross 2.Till 9.50am strong green candle(Bullish) & Strong red candle(Bearish).
Step-6(a): 3. 1Hr RSI>65 with Bollinger band breakout or resistance break 4. Bullish -> PUT OI Increasing & Bearish -> Call OI Increasing.
Step-7: Gapup/Down - NIFTY50 will not perform but sectors will have momentum - FNO Stocks which making HH.
Step-8: Between YH-YL 1. Sector rotation - Till 9.50am sector will move 2-3% then find stocks. 2. Low volume - Till 9.50 sector only 0.5-1% momentum wait till 12pm.